- Hedgie's Market Edge
- Posts
- Hedgie's Market Edge - October 6, 2025
Hedgie's Market Edge - October 6, 2025
Trading Without a Map: Week Two of the Data Blackout
Hey everyone, Hedgie here. So…we're flying completely blind. No jobs report Friday, no inflation data, nothing. The government shutdown created an information vacuum, yet markets added three more record highs last week. The S&P 500 is now up 114 sessions without a 5% pullback. When markets only go up because we can't see the problems, that's not strength.
The Data We Actually Have
Since official statistics vanished, here's what private sources show us. ISM Manufacturing sits at 49.1, marking seven straight months of contraction. Any reading below 50 means the sector is shrinking. ISM Services barely avoided contraction at 50.0, which is basically flatlining. ADP reported 32,000 job losses in September, the third decline in four months. The only bright spot was retail sales via Johnson Redbook showing 6% growth.
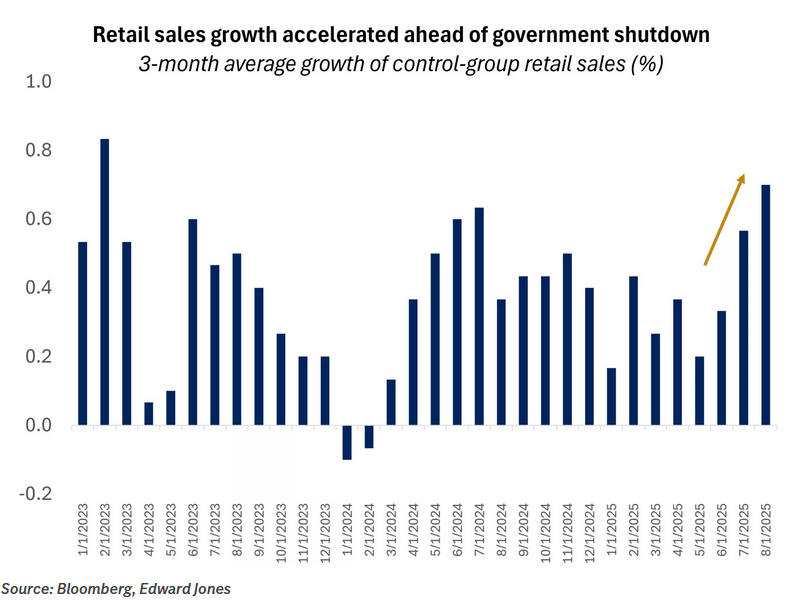
Retail sales growth accelerated ahead of the U.S. government shutdown
Manufacturing executives are using the word "stagflation" in their survey responses. That means prices rising while business falls. One transportation equipment executive said customers stopped buying rather than pay higher prices. When your choice is overpay or don't buy, and people choose don't buy, that's demand destruction.
The Shutdown Gets Real
This shutdown hits different. The administration threatened permanent cuts to 750,000 furloughed federal workers. That's not negotiation tactics anymore. Meanwhile, October 1st tariffs kicked in right on schedule. Pharmaceuticals face 100% tariffs, cabinets 50%, furniture 30%. Your medicine cabinet and actual cabinet just got way more expensive, assuming you can even get the products.

Some analysts claim economic impact remains limited because of resilient consumer spending. They're looking at retail sales from August. I'm looking at manufacturing executives saying their businesses are in "severe depression" right now. Big disconnect there.
AI's Power Problem Nobody Discusses
Everyone's excited about AI spending. Amazon, Google, Microsoft, and Meta plan $400 billion in capital expenditure next year. OpenAI alone needs electricity equivalent to New York City plus San Diego. We're valuing data centers at $40 billion that we literally cannot power.
The US adds about 30,000 megawatts of electrical capacity annually, spread across the entire country. If every major AI company needs 2,000 megawatts, the math doesn't work. We're choosing between powering AI or air conditioning. Guess which one voters care about more in July.
The Labor Market Reality
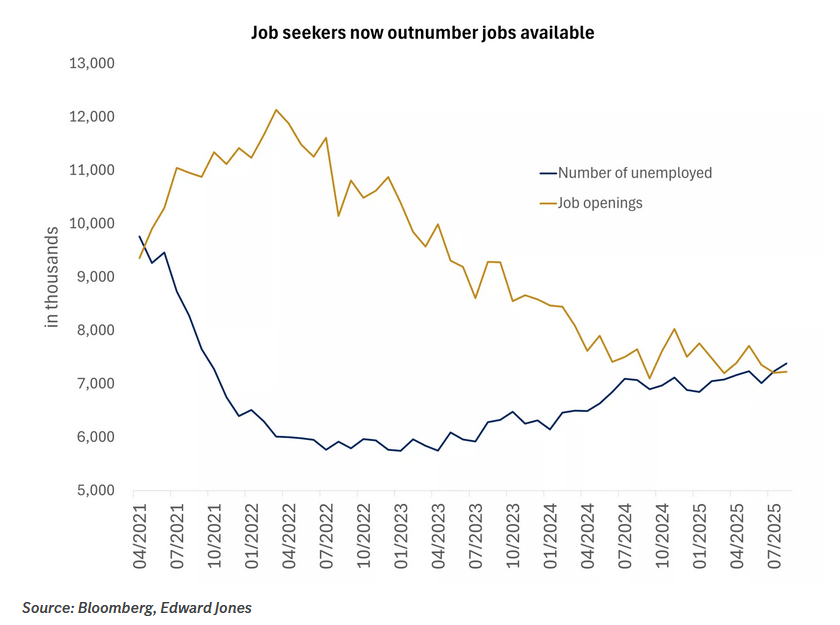
Number of job openings in the U.S.
Job openings just fell below the number of unemployed workers for the first time since 2021. That means musical chairs where someone's always left standing. Companies aren't hiring because of macroeconomic uncertainty, expected AI productivity gains, or both. Either way, workers lost their bargaining power.
Current evidence of employment weakness includes manufacturing employment down 8 straight months, services employment contracting with ISM Employment at 47.2, only healthcare and home health aides adding jobs, and the ratio of openings to unemployed flipping negative.
Gold Miners (The Profitable Boring Trade)
Semiconductors got all the attention with 40% gains this year. Gold miners delivered 135%. Nobody tweets about gold miners. No viral TikToks about mining equipment. Just 135% returns while everyone watched AI stocks. When boring inflation hedges triple the returns of revolutionary technology, pay attention.
The Fed Flying Blind
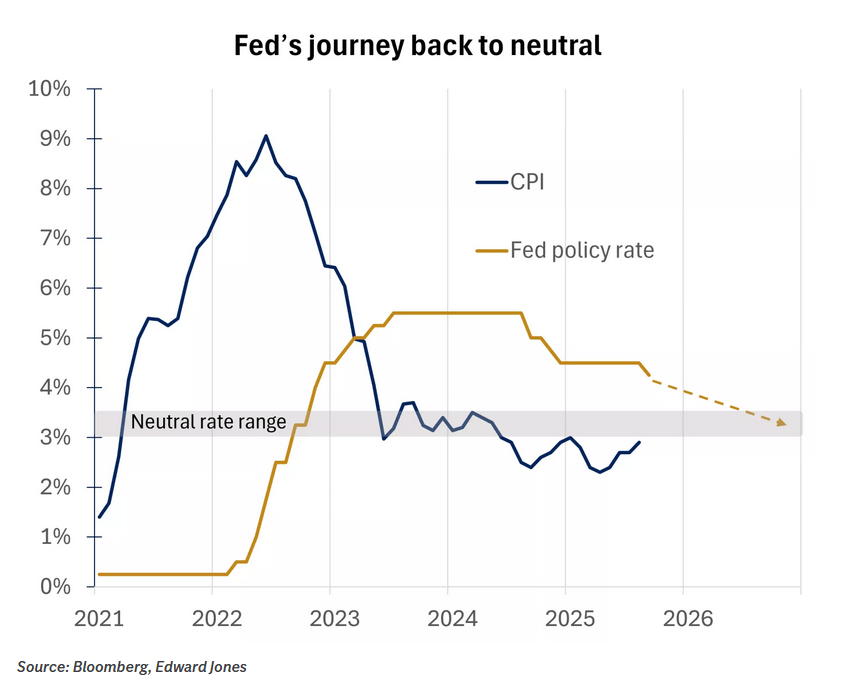
Fed officials are projecting a gradual rate-cutting path
The Fed's making decisions based on data that doesn't exist. Markets expect cuts October 29th toward a "neutral zone" around 3-3.5%. But how do you know what's neutral when you can't see anything? They're using ADP's 32,000 job losses as their guide. That's navigating by rumor instead of radar.
Historical Context Matters
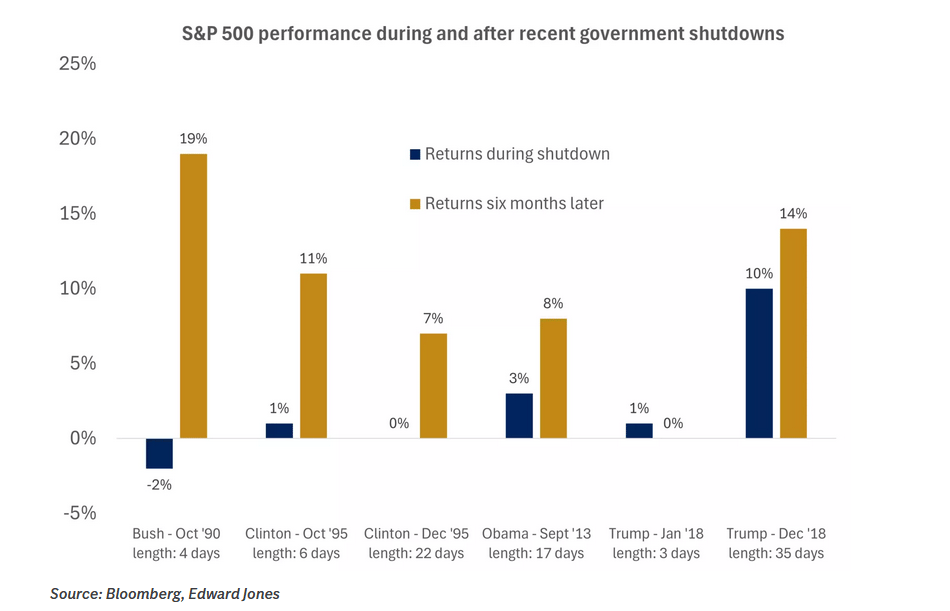
S&P 500 performance during and after U.S. government shutdowns since 1990
History shows shutdowns rarely impact markets long-term. Of 20 shutdowns since 1976, stocks were positive during half and higher three to six months later in most cases. But we've never had a shutdown during manufacturing recession with services stagnating and 114 sessions without correction. This time really might be different.
What I'm Doing With My Portfolio
After 114 sessions without correction, I'm taking profits. Not panicking, just recognizing when risk exceeds reward. Would you rather buy stock number 115 at a record high during a government shutdown with no economic data, or wait for an actual pullback with clear information?
I'm building cash reserves and a shopping list. Good companies will go on sale eventually. They always do. The patient investor gets better prices than the eager one.
Without official data, watch consumer credit and Michigan sentiment if the shutdown ends. Q3 earnings season begins, so tariff impact warnings matter. Fed officials will explain policy without any data to reference. Private sector indicators remain our only real information.
The Simple Truth
Markets celebrating while executives describe severe depression makes no sense. The shutdown isn't causing problems, it's hiding them. When the lights come back on, we'll see what's really there.
We're betting everything on AI productivity gains while actual manufacturers can't pass through basic costs. Gold miners beating tech stocks by 95 percentage points suggests some investors see what's coming.
October earned its reputation for volatility over decades. This year we're giving it extra ammunition. If you're still buying here, ask yourself what you know that nobody else does.
Remember, in markets, what you don't know absolutely can hurt you. And right now, officially, we know nothing. Except that markets keep going up anyway, which might be the most important data point of all.

Hedgie
Weekly Market Stats
INDEX | CLOSE | WEEK | YTD |
|---|---|---|---|
Dow Jones Industrial Average | 46,758 | 1.1% | 9.9% |
S&P 500 Index | 6,716 | 1.1% | 14.2% |
NASDAQ | 22,781 | 1.3% | 18.0% |
MSCI EAFE * | 2,810.41 | 2.5% | 24.3% |
10-yr Treasury Yield | 4.12% | -0.1% | 0.2% |
Oil ($/bbl) | $60.67 | -7.7% | -15.4% |
Bonds | $100.18 | 0.1% | 6.5% |
For educational purposes only. I'm a hedgehog who studies markets, not a financial advisor. Do your own research and remember that when everyone's euphoric and information's missing, patience becomes your edge.
Follow @HedgieMarkets for daily updates as we navigate without instruments.
Wall Street Isn’t Warning You, But This Chart Might
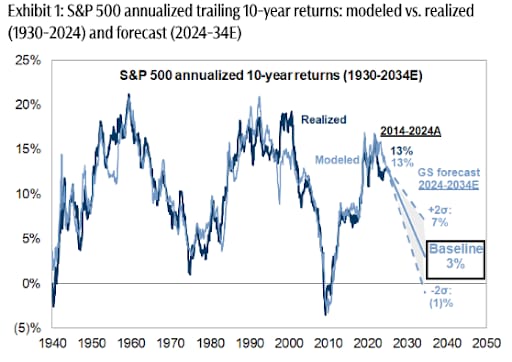
Vanguard just projected public markets may return only 5% annually over the next decade. In a 2024 report, Goldman Sachs forecasted the S&P 500 may return just 3% annually for the same time frame—stats that put current valuations in the 7th percentile of history.
Translation? The gains we’ve seen over the past few years might not continue for quite a while.
Meanwhile, another asset class—almost entirely uncorrelated to the S&P 500 historically—has overall outpaced it for decades (1995-2024), according to Masterworks data.
Masterworks lets everyday investors invest in shares of multimillion-dollar artworks by legends like Banksy, Basquiat, and Picasso.
And they’re not just buying. They’re exiting—with net annualized returns like 17.6%, 17.8%, and 21.5% among their 23 sales.*
Wall Street won’t talk about this. But the wealthy already are. Shares in new offerings can sell quickly but…
*Past performance is not indicative of future returns. Important Reg A disclosures: masterworks.com/cd.
Reply